

10,000 lost homes
To be justified, regulations must provide more benefits than harms

Regulations should do what they intended to do. As the economist Ronan Lyons once said “regulations should be judged by their effects.” Or, if you’d prefer, as Jesus said in the sermon on the Mount “by their fruits, you should know them.”
In that spirit, I want to talk about one such regulation: building energy performance standards. These are the regulations that require homes to be more energy efficient, for example to have better and more insulation.
Ireland’s system for evaluating this is called the Building Energy Rating (BER) which rates buildings from A to G. Irish homes have stricter energy ratings than they once did. From 1983 to 1993, over half of new builds had a BER rating of D or lower. Since 2015, 95 per cent of new homes have been A rated; since 2020, that figure has been 99 per cent.
This policy has had some good effects. It has made homes more comfortable, both by increased standards for new builds and by encouraging retrofitting in the existing stock.
But it also has had costs. It has meant fewer and more expensive homes. It has also partly failed on its own terms: it has not measurably reduced the energy consumption of homes.
I estimate that the 2019 change in building regulation has meant there are approximately 10,000 fewer homes today than there otherwise would have been. To calculate this, I built an interactive toy model which can be accessed here. But before explaining that calculation, I want to first describe the regulation, where it comes from, and what its purpose is.
What is the regulation?
There are a few different pieces of legislation that oversee different rules about what can be built. It is worth thinking of it as two parallel sets of rules.
There are planning rules, such as those found in development plans, which set out what can be built and where. These cover the kinds of uses permitted in particular areas, for example, ideally factories shouldn’t be in the middle of a housing estate. They also cover things like density, building heights, and urban form. It would be convenient to say that planning rules govern externalities, that is, they cover things that have spillover effects, like shadowing, public nuisance, and aesthetics. But the planning system controls other things that are “internal” effects, like the sizes of homes and gardens, the amount of light that gets into a home, and whether an apartment has a balcony or not.
Then there are building regulations, which govern the minimum functional standards or quality of the things that get built. As I mentioned, planning rules also reach into aspects of standards and quality, so this distinction is only a rough one. Building regulations set minimum performance standards for things like fire, access, ventilation, and structure.
The Minister of Housing, Local Government, and Heritage is empowered to set regulations about building rules through the Building Control Act. These rules are housed in the Building Regulations which are, in turn, interpreted through a series of manuals called technical guidance documents (TGDs). These set out some ways of complying with the building regulations. Compliance with the TGDs is seen as prima facie evidence of compliance with the building regulations.
TGD L is titled “Conservation of Fuel and Energy – Dwellings”. It is this TGD that sets out ways of complying with the building regulation that covers energy efficiency.
Energy efficiency covers a lot of things. The regulations govern everything from airtightness to thermal bridging, that’s the weak points in a building’s envelope, such as where a wall meets a floor or around windows, where heat escapes more easily. Principally, the regulations are looking at the rate of energy your home uses per square metre of floor space. This is sometimes called the primary energy demand and it is measured in kWh/m²/yr. It is calculated through the Dwelling Energy Assessment Procedure, or DEAP.
The BER must assume a hypothetical ‘representative’ household, in order to strip out the effects of different usage. The energy rating of the same building should be the same, regardless of whether it’s occupied by a single person living alone, or a family of five blasting the heating.
The simplifying assumptions made by the Sustainable Energy Authority of Ireland are known to be unrealistic. That is not necessarily a problem. The hypothetical household used to abstract away from details about usage to calculate energy efficiency shouldn’t change the ranking of how different buildings compare to one another. But there is a worry that the BER ratings are biased to different amounts for different dwelling types.
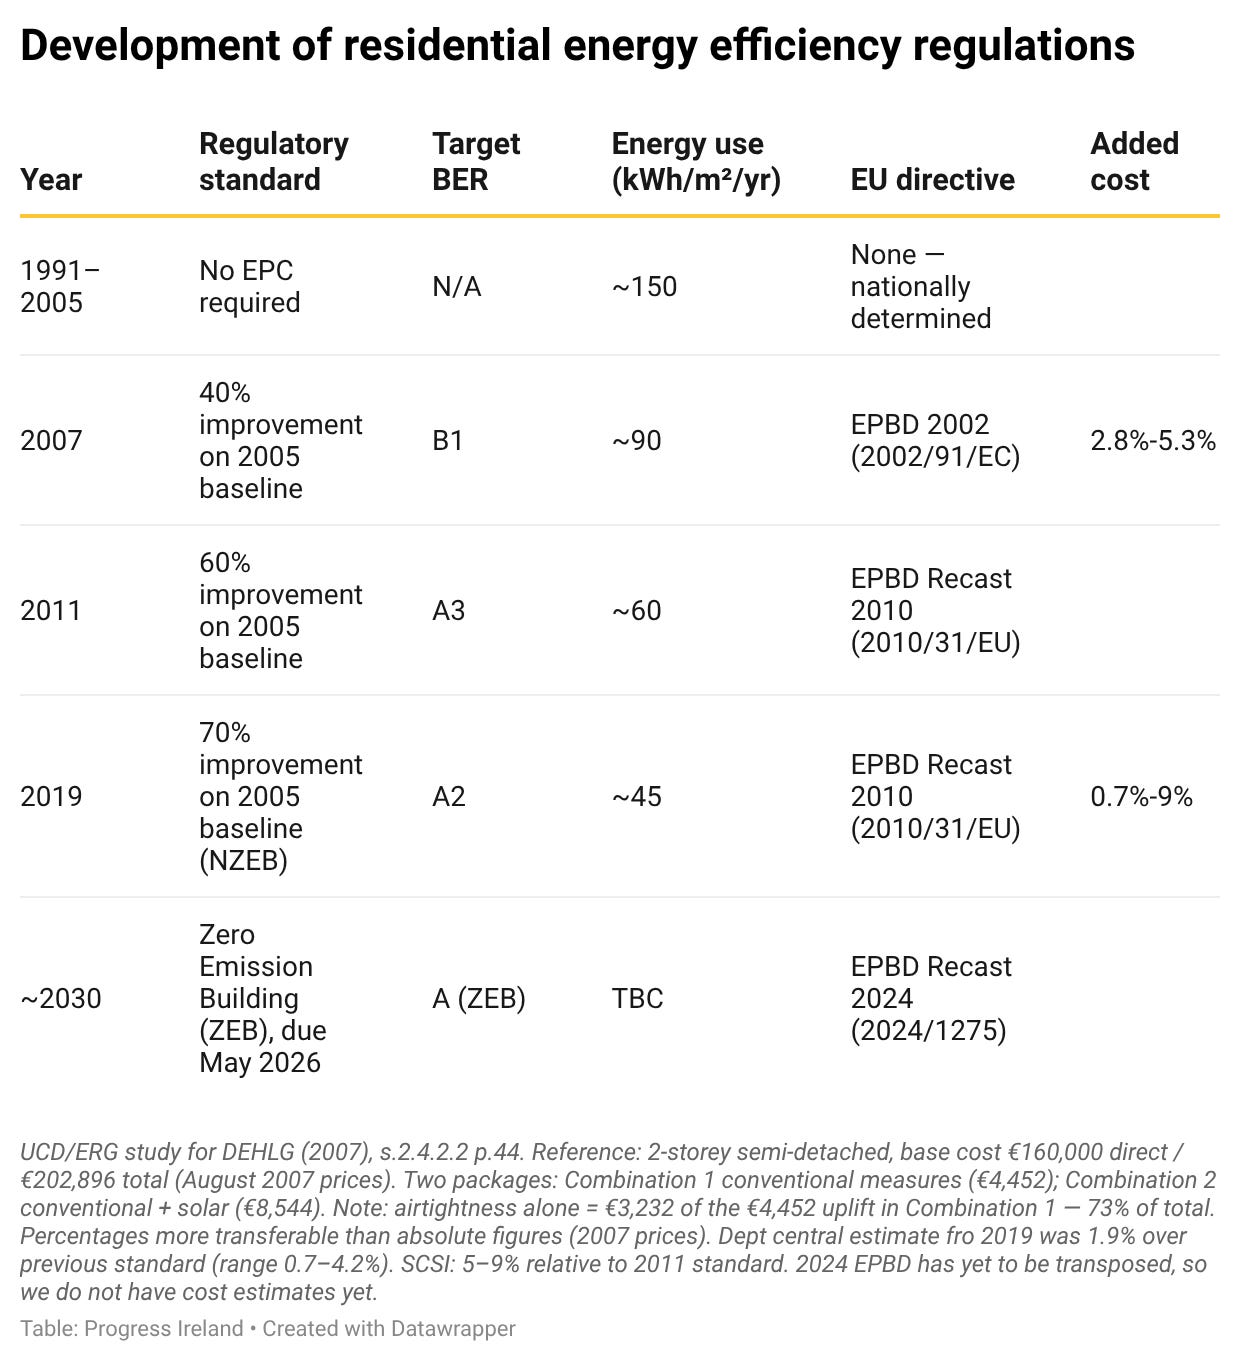
These regulations have progressively improved since 2007, guided by a series of European Directives, the Energy Performance of Buildings Directive (EPBD) of 2002, 2010, and 2024. From 2007, rules were introduced requiring a 40 per cent improvement in energy efficiency over 2005 levels. Likewise in 2011, further regulations saw a 60 per cent improvement relative to 2005 requirements. The 2010 EPBD required “nearly zero energy buildings” or NZEB by 2020. I have set out the changes to these regulations in the past years in the below table. I included the relevant European Directives which have been causing Ireland to change its regulations. In the table EPC means “energy performance certificate” and it is the term used at the European level.
The primary goal of this policy is to promote decarbonisation. Ultimately, the most recent Directive set the goal of “zero energy buildings.” We will see later that a recent report from the ESRI shows that this goal is probably not being achieved by this regulation.
How much does this regulation cost?
We know how much the government thought the regulation would cost. The then Department of Housing, Planning, and Local Government checked how much they expected the 2019 reforms to building standards to cost. In this report they scoped out different kinds of buildings. They landed on a range of 0.7 to 4.2 per cent over and above the previous year’s construction costs based on the former standards.
There is a standard way to think about the effects of increased costs on supply. It’s called elasticity. An elasticity is the ratio of a percentage response of one variable to a percentage change in another. Here, we are thinking about the response of housing supply to construction costs. We can ask: how much the number of homes built changes when construction costs change, other things being equal. We would expect cost elasticity of supply to be negative, that means that higher costs reduce supply because fewer developments are commercially feasible or viable.
A 2024 paper by Lyons and Günnewig-Mönert estimates a baseline cost elasticity of about -1.9, meaning a 1 per cent increase in construction costs is associated with roughly a 1.9 per cent fall in new housing supply, on average, in the long run.
Putting the government’s cost estimate together with Lyons and Günnewig-Mönert’s estimate of the supply elasticity on cost in Ireland, we can calculate how many homes were lost due to the increase in cost.
The model estimates that the single change in 2019 has resulted in 10,000 fewer homes that exist today than otherwise would if costs hadn’t risen as much. This doesn’t take into account the other changes to energy efficiency regulations in 2007 and 2011.
The calculation works by multiplying the cost uplift by the elasticity to get an annual supply reduction percentage. That percentage is then applied to actual CSO completions data for each year since November 2019. So if costs rose by 2% and the elasticity is −1.9, supply in any given year is estimated to be 3.8 per cent lower than it would otherwise have been. Summed across each year from 2019 to today, that gives you the cumulative figure. The model uses real annual completions rather than a fixed baseline, because Irish output varied significantly across the period. Applying a flat baseline across all years would overstate the early losses.
A model of this kind has lots of limitations. If you click through here, you can see the full model, including a section on its limitations. But I think it is instructive to take the impact of increased costs on supply seriously, even if any estimate is bound to have wide error bars attached.
This estimate is based on the government’s ex ante predictions of how much this regulation would cost. Using these predictions alone, the model estimates that 10,000 homes have been lost. But there are at least two reasons to think even these cost predictions underestimated it.
The first is a report from the Society of Chartered Surveyors Ireland from the year after the 2019 regulations were brought in. Between 2019 and 2021, housebuilding costs rose by about 7 per cent. According to the SCSI, “the main reason for cost increases was compliance with the new Nearly Zero Energy Building (NZEB) standards requirements and an increase in the cost of building materials.” These sound unrelated but they are deeply intertwined. Higher energy efficiency requirements mean you need different and often higher quantities of material. They leave builders more exposed to external price shocks. 7 per cent is an upper bound for how much NZEB standards increased costs and the real number is likely smaller.
If our model uses a 7 per cent increase in cost, we see that we have lost just under 25,000 homes, cumulatively, in counterfactual since 2019. That is roughly the equivalent of losing the entirety of Cork’s annual housing supply flow of about 4,500 homes a year.
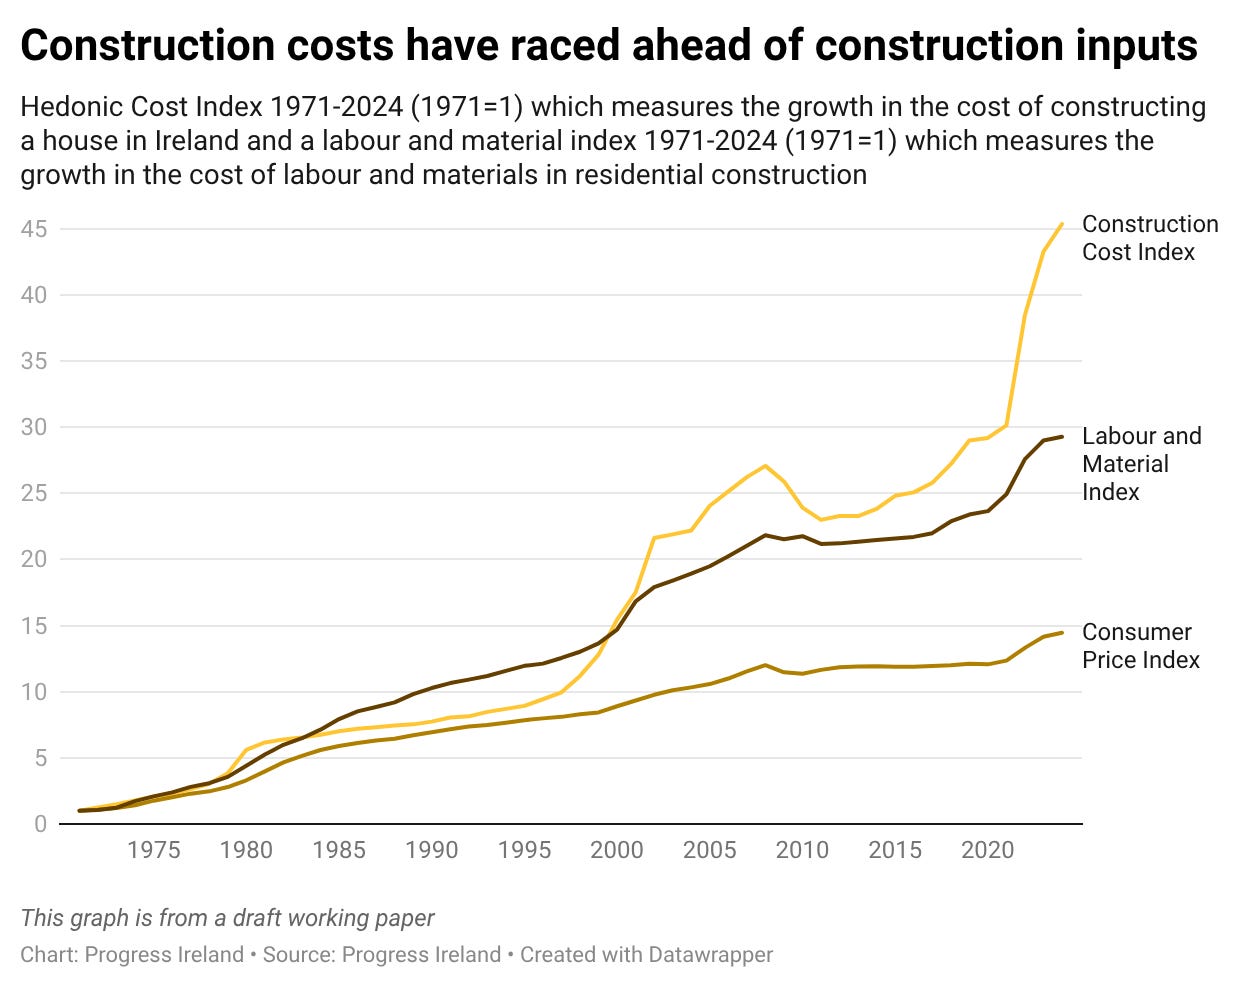
The second reason to be sceptical of the ex ante predictions comes from looking at overall construction inflation. Work I completed with Ronan Lyons shows that nominal construction costs have increased by a factor of almost 40 since 1971. In comparison, general inflation increased the price level by about 14 times. In real terms it costs 2.7 times more to build a home in 2025 than it did in 1971.
Why would this cast doubt on the government’s predictions of cost inflation? The main reason is that our analysis shows the inflation was not evenly distributed across the 50-odd years in the series. Inflation in the 1970s was mostly undone in the 1980s. Costs went up a lot in the early boom years. But between 2020 and 2025, costs rose by 40 per cent.
Another reason is that our index tracks the cost of constructing a home. Not the fixed unit costs of materials or labour. There is a separate index for those things called the Housing Construction Costs Index or HCCI (in the graph below, I call this the labour and material index). You can see here that construction cost inflation was higher than both the Consumer Price Index (CPI) and the HCCI. This suggests that there was something over and above general inflation or inflation in material and labour costs which is driving the high costs of construction inflation.
Of course, the existence of high levels of inflation does not prove that it was largely or solely caused by energy efficiency regulations. Nor would I like to insist that. But the existence of very high levels of inflation in the period coupled with a substantial change in the minimum energy efficiency required of new dwelling does make me update towards the view that the 0.7 to 4.2 per cent prediction was an underestimate.
If we assume that a quarter of the 40 per cent inflation that has occurred between 2019 and 2025 was due to Part L reforms, then that means there are just under 35,000 fewer homes today than there would have been had these reforms not taken place.
Have these regulations succeeded on their own terms?
Whatever the number, we know these regulations have imposed some costs. But all regulations involve trade-offs. Sometimes higher standards are worth the extra costs. This prompts the question: have these reforms succeeded on their own terms?
As before, the purpose of these reforms is to decarbonise the housing stock. One metric for this is whether homes built under these regulations are using less energy than homes built before.
A recent report by the ESRI has suggested that BER rating does not reliably predict actual energy usage. This passage from the report was particularly surprising:
A striking observation from the Irish studies of Coyne and Denny (2021) and Meles et al. (2025) is the lack of variation in average actual energy use between dwellings in different BER categories: average energy consumption is similar for an A-rated house and a G-rated house. Dwellings in the Coyne and Denny (2021) sample show that households [on average] consume around 10,869kWh/year, and this does not vary considerably by BER rating. A-rated dwellings consume an average of 10,569kWh/yr , whilst F and G-rated households consume an average of 10,964kWh/yr. Indeed, this may not be an Ireland-specific observation, with a UK study of office buildings by the Better Buildings Partnership (2019) finding a similar pattern of consumption.
In other words, A-rated dwellings use approximately the same amount of energy as G rated homes. Naturally, there are a variety of competing explanations for this observation. But in itself, the observation suggests that the goal of reducing household energy consumption is not being achieved by this regulation.
Building energy standards have imposed major costs. They have made construction more expensive which reduces supply. In order to be worth it, they must produce large benefits, such as reduced energy consumption. But the existing academic literature suggests that the relationship between energy ratings and energy use is weak. The regulations have made homes more comfortable. That matters. But the question is not whether warmer homes are good. It is whether they are worth the homes that were never built.
Really enjoyed the piece, Sean!
Great article. I have a friend of who moved to an A rated new build, and what did he do to celebrate? Set the heating temperature to 25 degrees in the middle of winter. Elasticity is as real as it gets